
How stressed are you right now? Or last week. It’s hard to recall yesterday, never mind last week. We all know college students get stressed and dealing with stress is an important part of navigating campus life. Well, now there is an app for that -- and you are about to implement your very own personal mobile stress meter to record your day to day stress levels across the term. You can customize this app and use it to reflect on your stress profile as the term ticks by -- like, wow, last week was so so stressful, or not, as the case may be.
This is a new lab (2016) where you get implement the StressMeter. Note, this app was developed as part of Sophia Haim’s 16 senior thesis -- see [1] for a paper on the stress meter, if interested; the paper was published in 2015 so this new research by a Dartmouth undergrad being brought into the classroom. The app queries the user multiple times during the day using a set of images that correlate with perceived stress level. The app records the stress meter scores and time stamps in a file (writes to stress_timestamp.csv) that can be visualized later (reads from stress_timestamp.csv).
This lab is your first big challenge in thinking about a systems design (think MVC) to a problem. We ask you to understand the coding problem and make it happen. You will have to learn some things not taught in class. We also ask you to use a new UI that incorporates the AppBar and NavigationView. You will see the new look of the UI when you download and play with the StressMeter APK.
We provide you with (project code handout -- see below) the images and a very basic class for accessing the images. You code all of the rest of the lab. We also provide an apk. We do not give lots of detailed description of the stress meter. You should play with the app, get a good sense of how it works and then implement it. Don’t worry if you don’t code an exact replica of the app. It should be close enough.
The app should “fire” based on a schedule that uses the Android alarmManager. The GridView of images are presented as shown in Figure 1(a). The user can select an image on the page or request “more images” by tapping on the “more images” button. There are 3 pages with 16 unique images in total. If the user selects an image then a larger version of the image is presented to the user, as shown in Figure 1(b). At this point the user can select or cancel. If the user selects the score is computed and stored in a file (stress_timestamp.csv) and the app is no longer visible to the user -- until the next time it ‘fires’. Figure 1(c) shows the score associated with the grid position. You should store the score and its timestamp in the file.
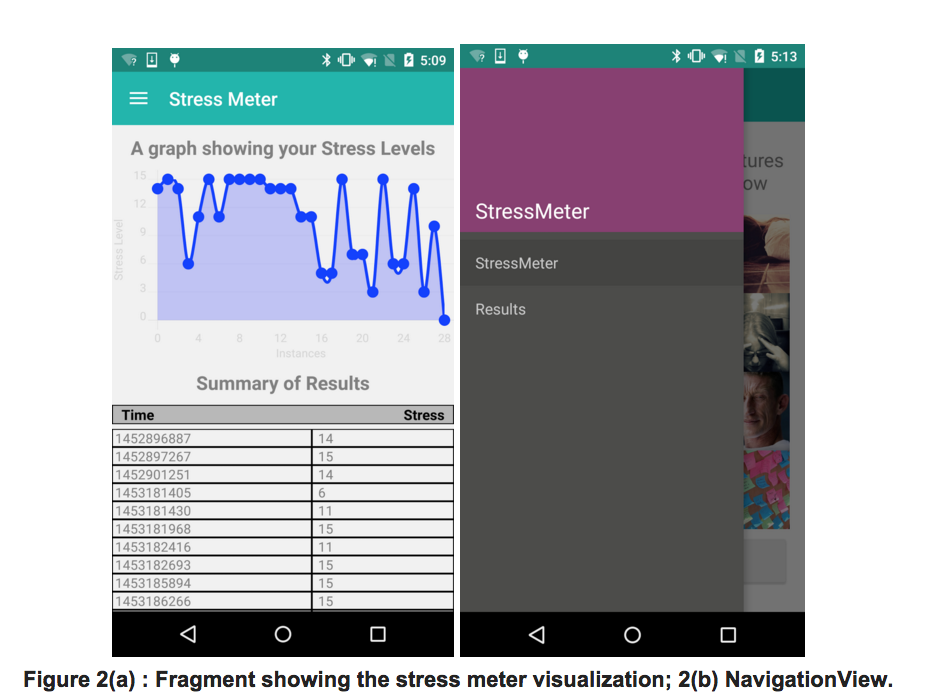
You should visualize the data that is being stored in the csv file (a CSV is a comma separated values file) by reading the data from the csv file, and using the graph plotting library to plot the graphs, as shown in Figure 2(a). Furthermore, you also display a table showing the stress meter score and timestamp. Once you try out the app this will all become clear.
You can switch between StessMeter GridView, and the visualization of the stress data by using the NavigationView, as shown in Figure 2(b). The NavigationView is new to you but you will recognize it as being the most common UI template among apps on Google Play. If you swipe from the left of the app, or click on the 3 horizontal lines on the top left corner of your app, then a sliding menu opens up, allowing you to switch between fragments (viz. StressMeter or Results). This is a very cool UI template that you can use in your group project at the end of term - we do not use this for MyRuns as you can see.
We want you to do the deep thinking about how to build this app. But we do not leave you high and dry. Feel free to design and customise it as you wish (but always implementing the basic functionality). The app comprises 4 views: the image request, image response, visualization and NavigationView. The image request (image GridView) and the visualization views should be fragments. Whereas the image response can be an activity. You will also have a MainActivity that contains your fragments and the navigation view.
The key view is a grid of the images we give you. This is a GridView. Please go through this example for more on GridView.
The NavigationView is a part of Android Design Support Library, It helps you create the slick sliding-over-everything navigation drawer that is such a recognizable part of material apps. Please go through this example for more on the AppBar and its NavigationView.
For the visualizations, you are free to use any third party library of your choice. The one used in our StressMeter demo app is as available here. To include this library in your project, add the following line as a dependency in your build.gradle file. (The same way you had done for MyRuns1). Note, we do not interact with Gradle much but when you use a library you have to include it in your dependencies:
compile 'com.github.lecho:hellocharts-library:1.5.8@aar'
The other key component that you will have to research and understand is the AlarmManager services which we use to fire the app -- bring it into the foreground view so it is visible to the user. You should schedule (i.e., fire) the app every day at 12.30 pm and 6.30 pm. Please read this; for debugging purposes you might do this every minute; see the following link to understand how to setup alarms that your app catches.
Finally, you note that the app gets your attention by making a sound. You can look at the MediaPlayer to workout how to do that,
First off install the StressMeter APK on your phone and make sure you understand the app and its workflow. There is no design document for this lab so you have to work out the MVC design and the components to implement. This is a good challenge for you rather than being given all the details.
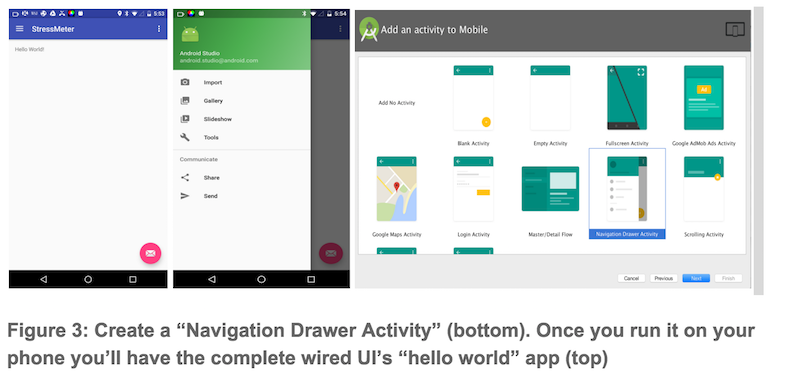
You should first create a new project call it StressMeter. As shown in Figure 3 you should create a Navigation Drawer Activity. Figure 3 shows the template for creating the activity and the two views of the HelloWorld activity that Android studio wires for you.
Once you have done this you should include the handout code into your project. You will need to first get acquainted with the new wiring for the UI and activity via references above. Then import the handout code and start coding and testing as you go. The project handout includes some software to help.
Good luck. This is a very cool project that bring mobile computing and psychology together. The mobile stress meter tool was designed to get at the user's internal stress state while on the go; that is, quicky and visually. Results from the reported scores correlates with a psychological survey called the Perceived Stress Scale. The mobile stress meter is inspired by the work on PAM.
Note, there is a large amount of code needed to be written compared to the first two labs so start early.
[1] Sophia Haim, Rui Wang, Sarah E. Lord, Lorie Loeb, Xia Zhou, and Andrew T. Campbell. "The Mobile Stress Meter: A New Way to Measure Stress Using Images." Presented at the 4th ACM Workshop on Mobile Systems for Computational Social Science (MCSS 2015), Osaka, Japan from Sep. 7-11, 2015 [pdf]
Congratulations again to Sophia for stellar research Spring 2015!