
You can debug code on the emulator or phone. The ADT environment offers the DDMS which represents a sophisticated tool for debugging code. Hopefully, most of the time this will suffice. Android is quite hard to program and debug (for me anyway) because of the large number of new APIs. If you are experienced with Java you will catch many of the obvious bugs from desk checking and looking for the obvious edge issues and API problems.
We also briefly discuss how to set breakpoints and look at variables in the code and run time.
There are a number of good resources for debugging in Android:
There are a number of tips when debugging -- here are some relevant to the type of coding we are doing:
Dump the stack trace
We show you how to log the stack trace.
Use debugging helper classes
Android provides debug helper classes such as util.Log and Debug for your convenience.
Display useful info on phone screen
The device can display useful information such as CPU usage or highlights around redrawn areas. Turn these features on and off in the developer settings window as described in Debugging with the Dev Tools App.
Log trace data
You can use the CatLog to log debug data and look at data. You can also log method calls and other tracing data in an activity by calling startMethodTracing(). See Profiling with Traceview and dmtracedump for details.
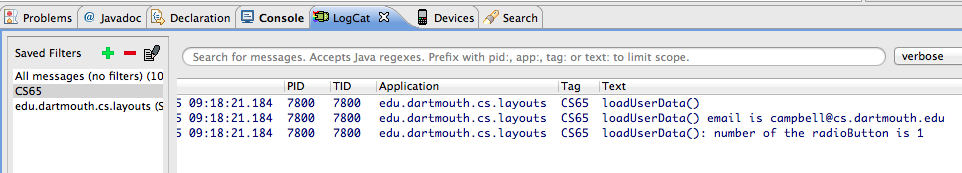
Before we get started note that the strange looking Log.d(TAG, "loadUserData()") method. This is associated with debugging. The Android system with keep a log of these Log.d() calls embedded in the code -- if you are C programmer these are like printf() but not to the screen (you would need toast to do that). Log.d printout (which could include data structures and member variable state) is directed to the LogCat. The logging system provides a mechanism for collecting and viewing system debug output. Logcat dumps a log of system messages and potentially much more. We will come back to logging. Right now you should know that you can run LogCat through the Dalvik Debug Monitor Server (DDMS) allowing you to read the messages in real time. Check out the screen dump of DDMS below. To display log messages (and BTW, the d in log.d refers to debug messages) you have to switch to the DDMS view from the default Java view. Then set up a filter in this case for the TAG CS65. This is set up at the start of the activity
private static final String TAG = "CS65";Then run the app. For example, start the SharedPreference activity from the main menu and hit the Save. You should see the two log message shown in the screen dump below. Please do this and play with the log system. More on debugging later. We will need debugging tools. Note, this is all from the phone. I did not run this under the emulation mode -- it's too darn slow.
You can print out the value of member variables in your code using Log.d(); for example:
 Log.d(TAG, "loadUserData() email is " + mValue);

 Log.d(TAG, "loadUserData(): number of the radioButton is " + mIntValue);
The equivalent using toast is for the radio button is:
    Toast.makeText(getApplicationContext(),
                    "number of the radioButton is : " + mIntValue,
                    Toast.LENGTH_SHORT).show();
But remember Toast is not for debugging -- the toast is fleeting, pops up and disappears but the log.d is always there afterwards to study.
If I run the layouts code and click on SharedPreferences I get this in LogCat.
This relates to this code in SharedPreferencesActivity.java in the layouts project:
    private void loadUserData() {

        // We can also use log.d to print to the LogCat

        Log.d(TAG, "loadUserData()");

        // Load and update all profile views

        // Get the shared preferences - create or retrieve the activity
        // preference object

        String mKey = getString(R.string.preference_name);
        SharedPreferences mPrefs = getSharedPreferences(mKey, MODE_PRIVATE);

        // Load the user email

        mKey = getString(R.string.preference_key_profile_email);
        String mValue = mPrefs.getString(mKey, " ");
        ((EditText) findViewById(R.id.editEmail)).setText(mValue);

        Log.d(TAG, "loadUserData() email is " + mValue);


        // Please Load gender info and set radio box

        mKey = getString(R.string.preference_key_profile_gender);

        int mIntValue = mPrefs.getInt(mKey, -1);
        // In case there isn't one saved before:
        if (mIntValue >= 0) {
            // Find the radio button that should be checked.
            RadioButton radioBtn = (RadioButton) ((RadioGroup) findViewById(R.id.radioGender))
                    .getChildAt(mIntValue);
            // Check the button.
            radioBtn.setChecked(true);
            Toast.makeText(getApplicationContext(),
                    "number of the radioButton is : " + mIntValue,
                    Toast.LENGTH_SHORT).show();
            Log.d(TAG, "loadUserData(): number of the radioButton is " + mIntValue);
        //  Log.d(TAG, Log.getStackTraceString(new Exception()));
        }

}When your app crash for example because of a nullPointerException or something the ADT prints it prints out the full stack trace.
If you want to print out the full stack trace. Inserting the following code into your program will force a checkpoint of the stack to be dumped to the CatLog.
Log.d(TAG, Log.getStackTraceString(new Exception()));If I uncomment this line in my code above SharedPreferencesActivity.java then I get the following stack dump in the CatLog
04-05 09:24:20.137: D/CS65(8434): loadUserData()
04-05 09:24:20.147: D/CS65(8434): loadUserData() email is campbell@cs.dartmouth.edu
04-05 09:24:20.157: D/CS65(8434): loadUserData(): number of the radioButton is 1
04-05 09:24:20.157: D/CS65(8434): java.lang.Exception
04-05 09:24:20.157: D/CS65(8434):   at edu.dartmouth.cs.layouts.SharedPreferencesActivity.loadUserData(SharedPreferencesActivity.java:100)
04-05 09:24:20.157: D/CS65(8434):   at edu.dartmouth.cs.layouts.SharedPreferencesActivity.onCreate(SharedPreferencesActivity.java:28)
04-05 09:24:20.157: D/CS65(8434):   at android.app.Activity.performCreate(Activity.java:5104)
04-05 09:24:20.157: D/CS65(8434):   at android.app.Instrumentation.callActivityOnCreate(Instrumentation.java:1080)
04-05 09:24:20.157: D/CS65(8434):   at android.app.ActivityThread.performLaunchActivity(ActivityThread.java:2144)
04-05 09:24:20.157: D/CS65(8434):   at android.app.ActivityThread.handleLaunchActivity(ActivityThread.java:2230)
04-05 09:24:20.157: D/CS65(8434):   at android.app.ActivityThread.access$600(ActivityThread.java:141)
04-05 09:24:20.157: D/CS65(8434):   at android.app.ActivityThread$H.handleMessage(ActivityThread.java:1234)
04-05 09:24:20.157: D/CS65(8434):   at android.os.Handler.dispatchMessage(Handler.java:99)
04-05 09:24:20.157: D/CS65(8434):   at android.os.Looper.loop(Looper.java:137)
04-05 09:24:20.157: D/CS65(8434):   at android.app.ActivityThread.main(ActivityThread.java:5041)
04-05 09:24:20.157: D/CS65(8434):   at java.lang.reflect.Method.invokeNative(Native Method)
04-05 09:24:20.157: D/CS65(8434):   at java.lang.reflect.Method.invoke(Method.java:511)
04-05 09:24:20.157: D/CS65(8434):   at com.android.internal.os.ZygoteInit$MethodAndArgsCaller.run(ZygoteInit.java:793)
04-05 09:24:20.157: D/CS65(8434):   at com.android.internal.os.ZygoteInit.main(ZygoteInit.java:560)
04-05 09:24:20.157: D/CS65(8434): at dalvik.system.NativeStart.main(Native Method)First the app crashes when installed and launched.
Here is how the bug does down. We use the LogCat on errors. We look through them after the crash.
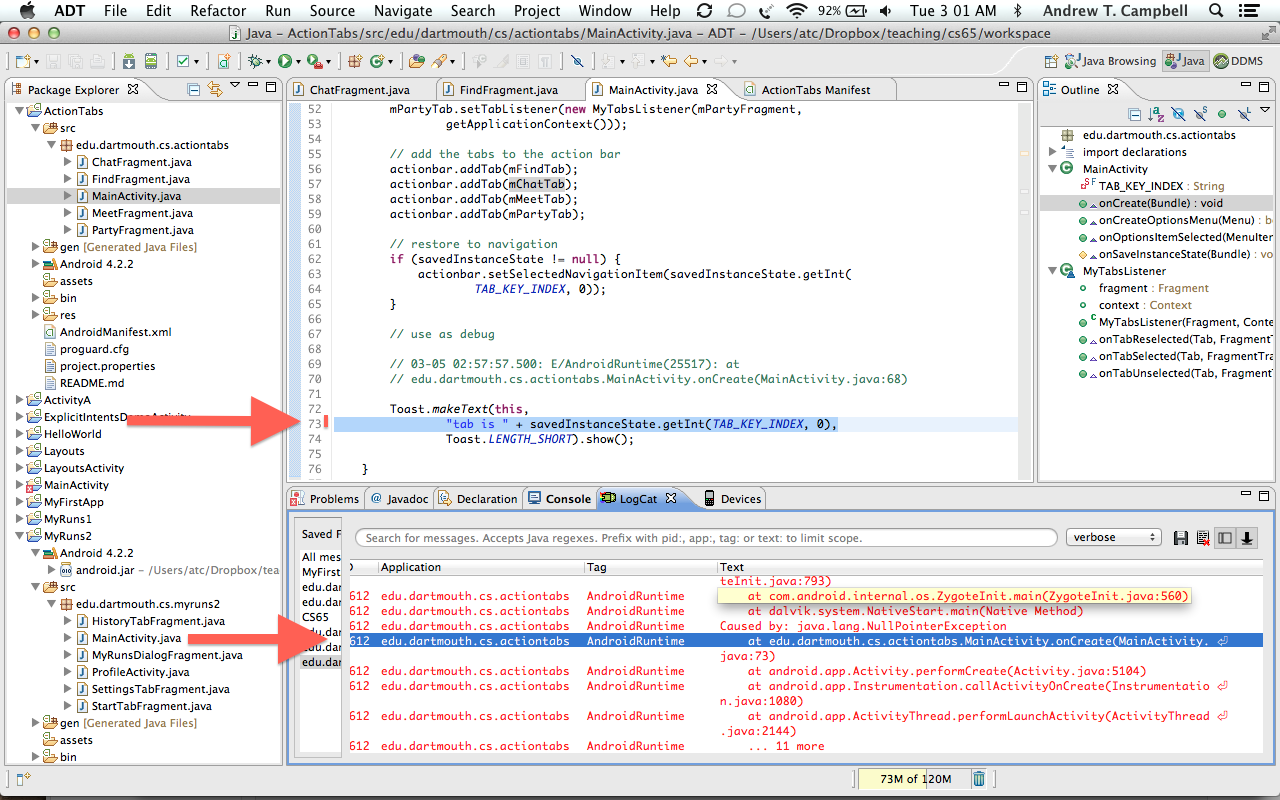
Right we see this message:
In the code below savedInstanceState is a Null; therefore we get an exception. {.java} 03-05 03:07:27.058: E/AndroidRuntime(27955): Caused by: java.lang.NullPointerException 03-05 03:07:27.058: E/AndroidRuntime(27955): at edu.dartmouth.cs.actiontabs.MainActivity.onCreate(MainActivity.java:73)~
OK we know the exact line of the crash or exception; it's a NullPointerException.
        // restore to navigation
        if (savedInstanceState != null) {
            actionbar.setSelectedNavigationItem(savedInstanceState.getInt(
                    TAB_KEY_INDEX, 0));
        }

        Toast.makeText(this,
                "tab is " + savedInstanceState.getInt(TAB_KEY_INDEX, 0),
                Toast.LENGTH_SHORT).show();
Ah, savedInstanceState is Null and trying to call a method on a null object. Bad. The reason savedInstanceState is Null is because the first time the app is run it will always be Null therefore the fix is.
        // restore to navigation
        if (savedInstanceState != null) {
                Toast.makeText(this,
                "tab is " + savedInstanceState.getInt(TAB_KEY_INDEX, 0),
                Toast.LENGTH_SHORT).show();

            actionbar.setSelectedNavigationItem(savedInstanceState.getInt(
                    TAB_KEY_INDEX, 0));
        }
OK. Let's build and see what we get.

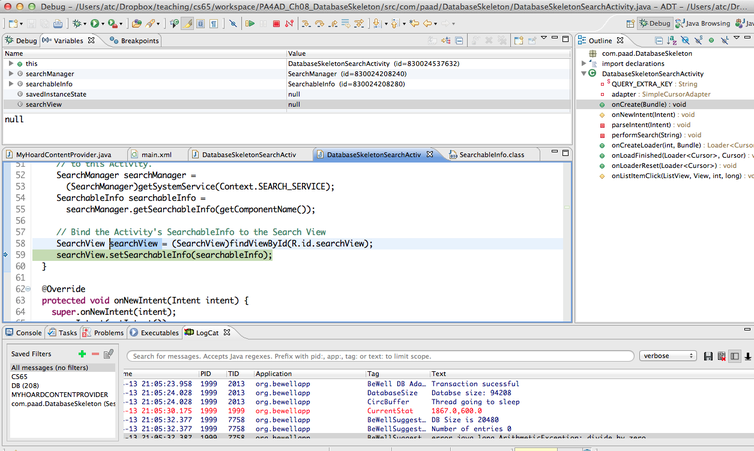
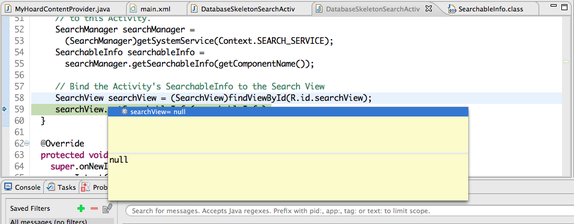
Many times you will need to run your code in debug mode in Eclipse set breakpoints and inspect variables to work out exactly what happened before you program crashed; for example in the code below there is an exception because of a NULL reference is accessed. We know the CatLog that the exception happened at line 59 from the output. But we do not know why the exception occurred.
So we set a breakpoint at line 58 -- the line before the exception and then look at the variables such as searchManager and searchableInfo to see if they are OK. If they are then we single step to the next line 59. We notice, however, that once line 58 is executed that searchView is NULL, which is a bug.
50     // Use the Search Manager to find the SearchableInfo related
51     // to this Activity.
52     SearchManager searchManager =
53       (SearchManager)getSystemService(Context.SEARCH_SERVICE);
53     SearchableInfo searchableInfo =
54       searchManager.getSearchableInfo(getComponentName());
55
56    // Bind the Activity's SearchableInfo to the Search View
58     SearchView searchView = (SearchView)findViewById(R.id.searchView);
59     searchView.setSearchableInfo(searchableInfo);
60
Read the very good Java Debugging with Eclipse - Tutorial by Lars Voglel.
I do not have good notes on debugging using ADT and strongly recommend that you read the tutorial so you get some debugging chops.
Many of you have debugged Java in CS1. For Android you do almost exactly the same. Make sure your phone is plugged in and debug perspective is shown as shown below
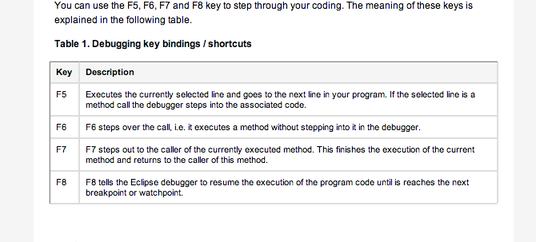
Typically you want to do the following when you have a bug in your code and want to get to the bottom of it:
Notice, if you place the cursor over a variable the debug mode with show the value -- the example below shows the SearchView reference is NULL. That is a problem for this code!
It is good to just set a breakpoint at the start of your code e.g., onCreate() or in a helper function or many methods and functions and just step through the code and look variables in the program. This is good practice and can help you fine problems.
But there is nothing as good as desk checking your code -- that is, reading closely through your code and "executing it" with a pen and paper.