Predictive Applications of Ensemble Methods: NBA Betting�
Gediminas Bertasius, Jason Wardy, Michelle Shu
Overview of Problem
We created machine learning models to make predictions on two types of NBA bets: Over/Under (OU), which represents the combination of two teams' scores and Against the Spread (ATS), which represents the difference between two teams scores. By the milestone, our system had already exceeded the minimum profit margin on these bets by making correct predictions for over 52.63% of the outcomes. We assessed the performance of our model by computing its proportion of winning past bets relative to the cutoffs established by the bookmaker. We also evaluated the performance of our models based on the root mean squared error of the raw numerical scores produced (i.e. sum and difference of point values).
Since the milestone, we have been able to stabilize and improve the performance of our decision tree-based models by adding more examples (from more seasons) to our training set. We also implemented a newer variation of AdaBoost for regression called AdaBoostRT.
Current State of the Art
Few academic forays have been made into the world of sports betting. The research that has been done on this topic is focused on the binary classification problem of predicting wins/ losses, rather than the point values of ATS and O/U bets. Some methods that have been used for these bets include logistic regression, SVMs and AdaBoost. [12] [13]
Data
Our original dataset from ESPN consisted of one training season (2009-10, N = 754) and one test season (2010-11, N = 811). Our betting cutoff data came from the Oddshark betting database. [6] [7]
Since the milestone, we expanded our training set by collecting data from the database on NBA's official website. For each individual game collected the following 9 types of statistics representing average season past performance of 4 groups: home team, home team opponent, road team and road team opponent, for a grand total of 36 feature dimensions:
- Field goals made
- 3-point field goals made
- Free throws made
- Total rebounds
- Assists
- Steals
- Blocks
- Turnovers
- Game score
Our new training set covers 5 seasons of games from 2007-11 (N = 4730) and our test set covers 2011-12 (N = 628).
Methods and Results
Ensembles of Trees
Base Classifier: Pruned Variable Random Tree
We are using the VR-Tree as a base classifier for several ensemble methods composed of many individual trees. The VR-Tree algorithm works in a similar way as a regular decision tree except that there is a randomization factor introduced in the process of building a tree. As one of the parameters user must specify the probability with which tree will generate deterministic nodes. Randomly split nodes will be generated with the complement of the probability specified in the parameters. [3] [1]
Pruning is done based on reduced-error algorithm. While building each tree, 20% of the data is left out for the testing purposes. At each iteration the node that produces the biggest reduction of the error in test sample is selected for pruning. Iterations continue until further pruning becomes harmful. [1] [9]
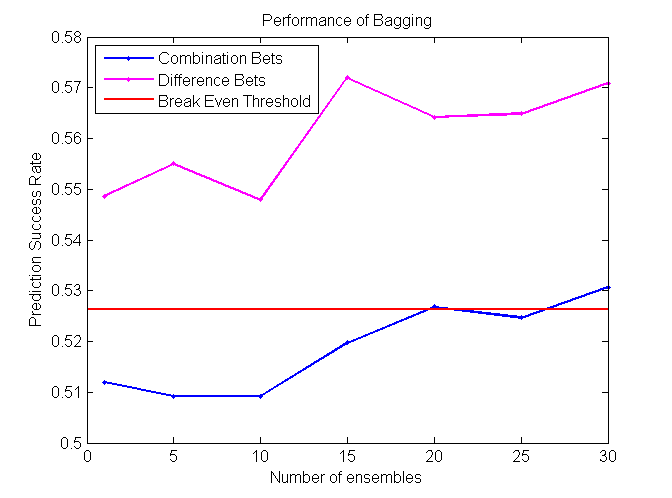
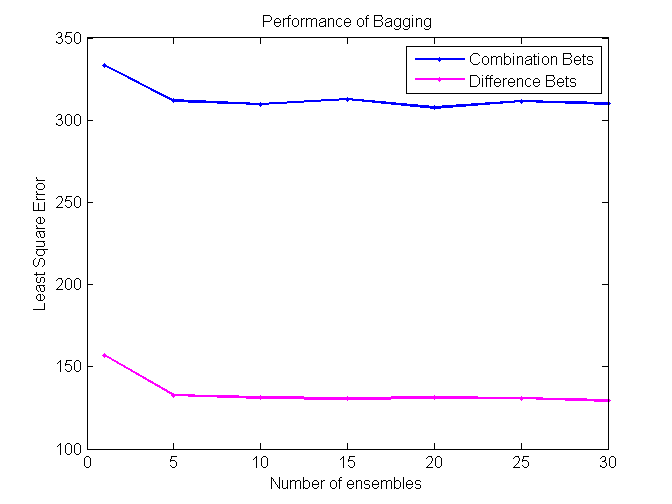
Bagging
Bagging (Bootstrap sampling) relies on the fact that combination of many independent base learners will significantly decrease the error. Therefore we want to produce as many independent base learners as possible. Each base learner (VR-Tree in our case) will be generated by sampling the original data set with replacement. With each sampling there will be approximately 36.8% samples that have not been used for the training process. These samples will be used to estimate the error in pruning. N (user specified parameter) such ensembles will be generated and for each prediction each of them will vote. Average of their votes will be used as a final prediction. [2] [3]
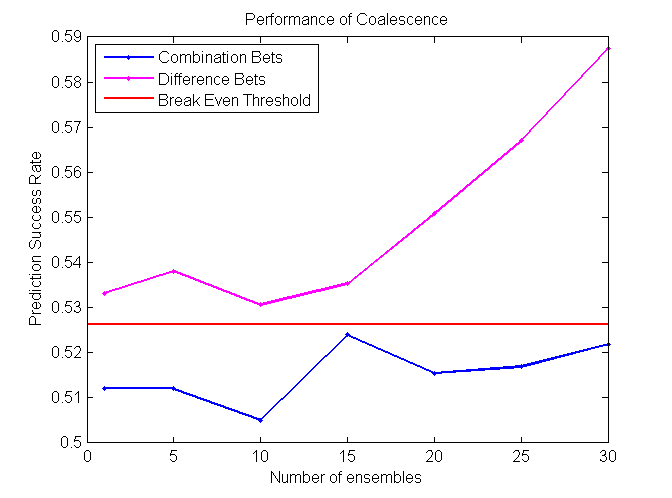
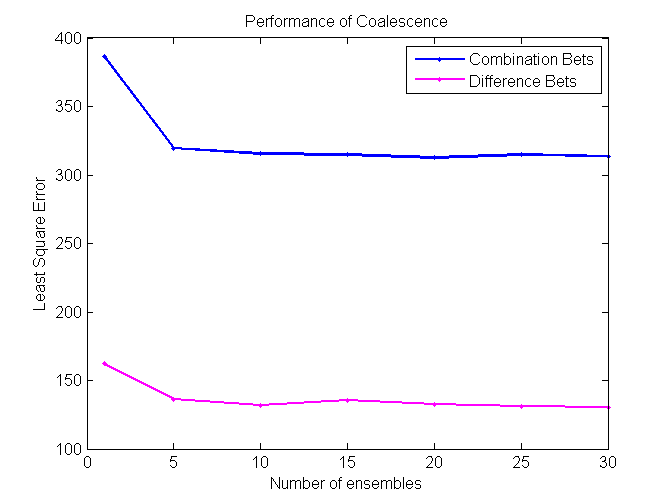
Coalescence
Coalescence is another ensemble method that relies heavily on randomly generated trees. N individual VR-Trees will be generated and each of them will have a different probability of producing deterministic nodes. As in the case with bagging, average of all N classifiers votes will be used for a final prediction. [2] [3]
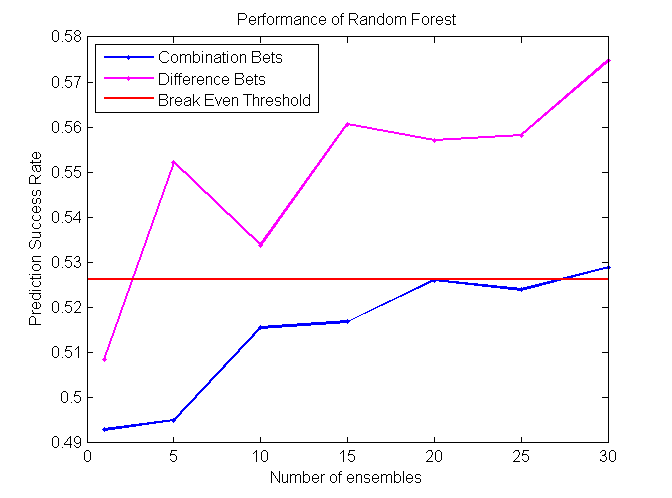
Random Forest
Random Forest is an extension of bagging where the major difference is the incorporation of randomized feature selection. At each step Random Forest algorithm will randomly select some set of features (subset of the original set of features) and produce a traditional deterministic split. N such trees will be produced, and their average vote will be used as a final prediction. [2] [3]

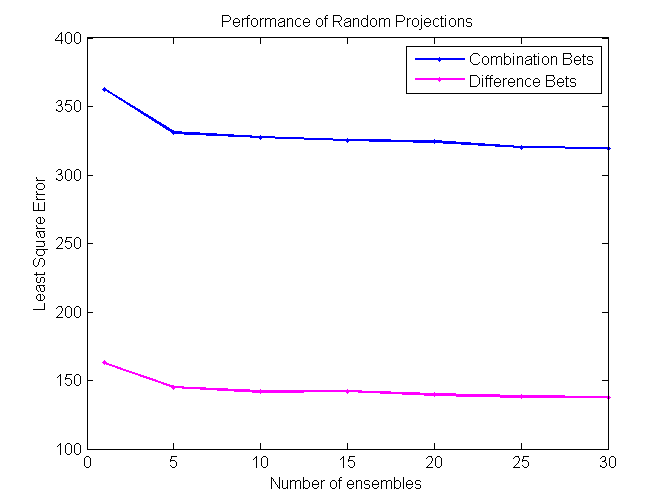
Random Projections
Random Projections algorithm is almost identical to regular decision trees algorithms, except for the fact that it uses multiple features to determine the split at each node. At each split some subset of features is randomly selected. Then random weights for each of those features are selected. Finally, the best split for that particular set of weights is found. The procedure is repeated k times and the best resulting split is picked out of those k trials.

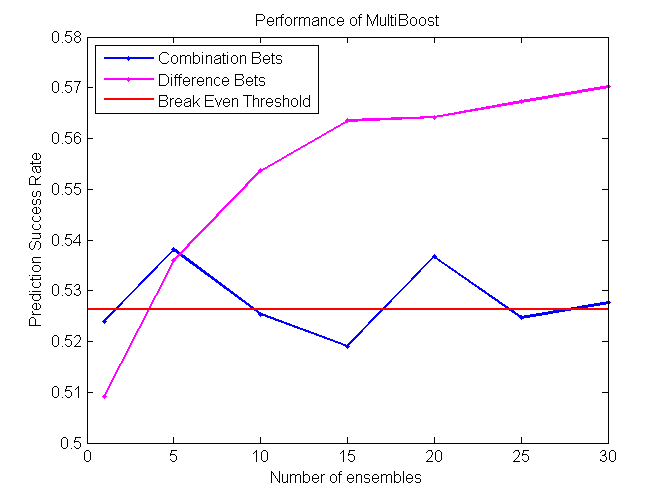
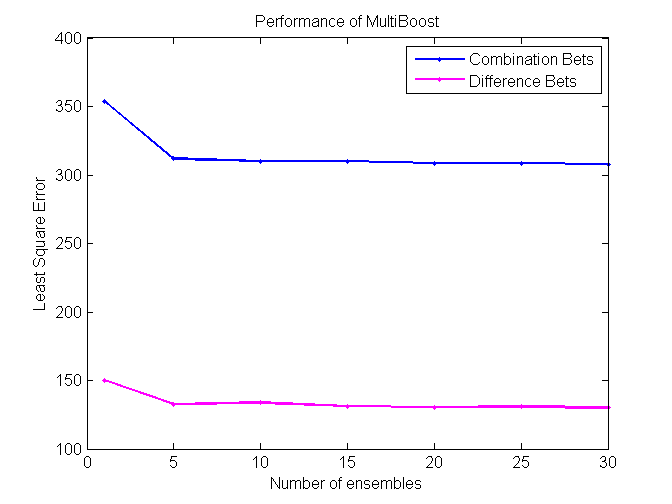
MultiBoost
MultiBoost algorithm combines two commonly used techniques: Bagging and Boosting. The motivation for MultiBoost algorithm comes from the observations that Boosting decreases bias of the error, while bagging decreases variance. Hence, combining two of these techniques may decrease both and increase the overall performance of the algorithm. Based on the empirical evidence, researchers claim that Adaboost gains the most benefit out of the first several iterations. As a result, it may be beneficial to let Adaboost run for some pre specified number of iterations, reset the weights, and then run it again. This procedure would be repeated until some termination criteria is reached. For this algorithm, we use VR-trees as our base classifier. [10]
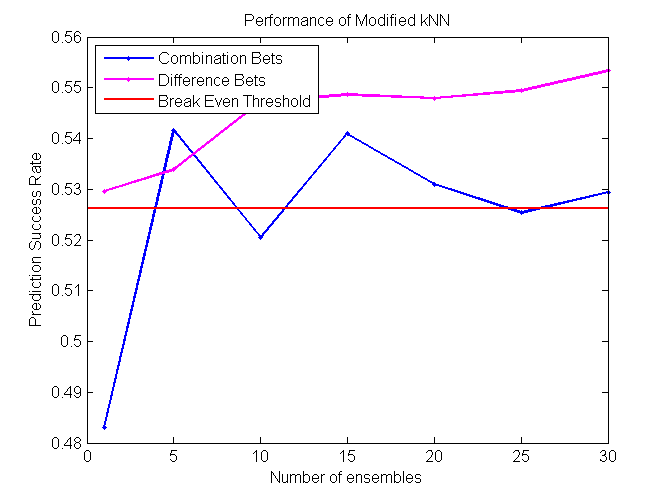
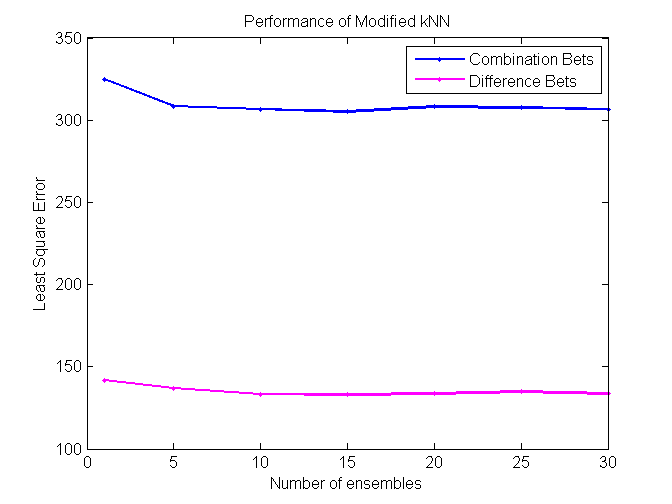
Modified k Nearest Neighbors (kNN)
Despite its simplicity, kNN is probably one of the most effective Machine Learning algorithms. However, one major shortcoming of regular kNN is the use of Euclidean distance, instead of some more advanced metric learning technique. Euclidean distance gives equal weight for each feature, which is very unlikely in large and noisy datasets. In our modified version of kNN, we build N VR-trees using random forest algorithm. After this procedure, we take some specified fraction of features from each tree in the forest and use only those features to calculate Euclidean distance. In other words, the features collected from each tree will correspond to one kNN classifier. If we have built N trees, we will also have N kNN classifiers. Each classifier will vote and the final vote will be determined as an average of the sum of the votes.
AdaBoostR: AdaBoost for Regression
AdaBoost (adaptive boosting) is a method to generate strong classifiers from a pool of weak classifiers. This is done by iteratively training weak classifiers on a weighted distribution of training examples (currently misclassified examples are weighted higher), and then boosting their weights appropriately so that the weighted sum of their contributions provides an optimal prediction of the target value. [7]
AdaBoost is proven to be a very strong method for classification problems, but is rarely used for regression problems. We attempted to apply two variations of AdaBoost for regression. For the milestone, we implemented the AdaBoostR algorithm described in Zemel & Pitassi (2001). [11] However, AdaBoostR failed to fit our training data well, because the learning objective (based on exponential squared error) only works well when input features are in the range of 0 to 1.
Weak Learner: Linear Least Squares Regression on Subset of Feature Space
The weak learner we are using is derived by choosing, on each iteration, a random subset of feature dimensions and performing least squares regression along selected dimensions only with iterative batch gradient descent. We experimented with subset sizes of 5, 8 and 10 feature dimensions.
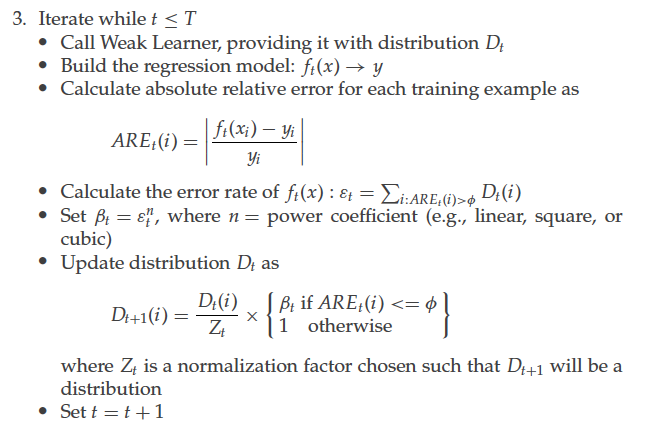
The AdaBoostRT Algorithm
AdaBoostRT iteratively recruits weak learners based on a distribution of training examples reflecting the strengths of the current committee (examples that are hard to predict for current committee are weighted more heavily). We only accept weak learners that meet our standards, by predicting with an error rate of less than 49.5%, where errors are determined by demarcation threshold phi. After being accepted, the new weak learner's weight and the training distribution are updated. The algorithm for AdaBoostRT training, written by Shrestha and Solomatine. [8]
Results
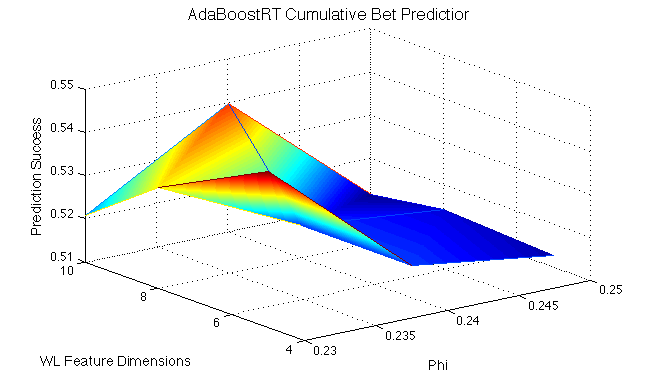
We recruited weak learners into our AdaBoost model until either 100 weak learners were recruited or 200 weak learners in a row were rejected. We found that the weak learners themselves were strong, perhaps too strong to benefit too much from boosting. We found our highest accuracy success with the following runs:
- 3 weak learners (feature subset size 5) recruited at phi = 0.23: 54.6% accuracy
- 37 weak learners (feature subset size 10) recruited at phi = 0.24: 53.98% accuracy
Basically, this shows that if we are less strict with weak learner recruitment (higher phi values), we can recruit more learners into the system, but we have to balance the factors of phi and complexity of weak learners (number of feature dimensions) to find local optima.
While AdaBoostRT resulted in greater prediction success than AdaBoostR, it performs weakly when presented with data whose target values lie in a small range that incorporates 0, such as our difference bet problem. When we attempted to train AdaBoostRT to predict difference bets, it's predictions all approached 0, exhibiting this major limitation that extends from its learning objective.
Summary of Results
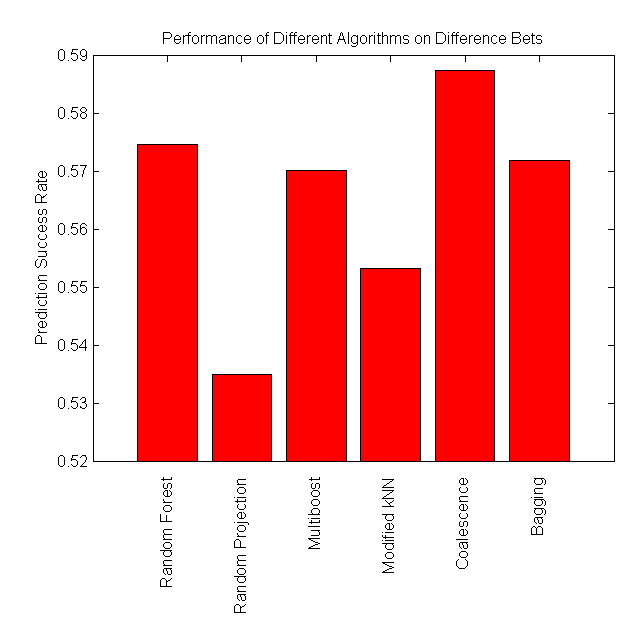
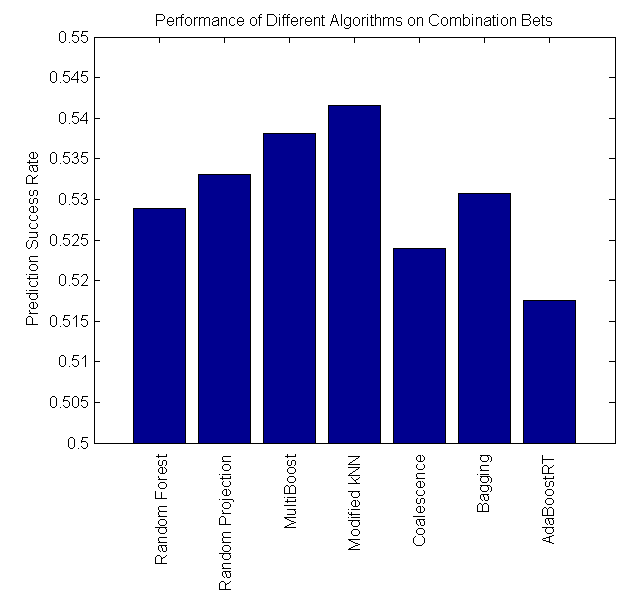
Our project is successful, as some algorithms perform at around 57%, which is significantly higher than the minimum cutoff required to make a profit betting in the NBA. We found that Coalescence and Random Forest perform the best on difference bets, while Modified kNN performs the best on combination bets.
| |
RMS Error (Combination) |
Prediction Success (Combination) |
RMS Error (Difference) |
Prediction Success (Difference) |
Random Forest |
17.520 |
0.5260 |
11.291 |
0.5747 |
Bagging |
17.538 |
0.5267 |
11.422 |
0.5719 |
| MultiBoost |
17.562 |
0.5380 |
11.425 |
0.5672 |
| Coalescence |
17.681 |
0.5239 |
11.433 |
0.5824 |
| Random Projection |
17.893 |
0.5310 |
11.760 |
0.5338 |
| Modified kNN |
17.470 |
0.5416 |
11.535 |
0.5493 |
| AdaBoostRT |
18.156 |
0.5179 |
- |
- |


Return on investment in NBA betting using these machine learning techniques could result in 5 times the profit acquired by investing in top hedge funds!

Future Directions
Improvements can be made to our work thus far by exploring different types and combinations of input features and different training set sizes. Additionally, using a simpler weak learner for AdaBoostRT could produce improved results.
References
[1] Breiman, Leo. Classification and Regression Trees. Belmont, CA: Wadsworth International Group, 1984.
[2] Zhou, Zhi-Hua. Ensemble Methods: Foundations and Algorithms. Boca Raton, FL: Taylor & Francis, 2012.
[3] Liu, Fei Tony, Kai Ming Ting, Yang Yu, and Zhi-Hua Zhou. "Spectrum of Variable-Random Trees." Journal of Artificial Intelligence Research (2008).
[4] Barros, Rodrigo, Ricardo Cerri, Pablo Jaskowiak, and Andre Carvalho. "A Bottom-Up Oblique Decision Tree Induction Algorithm." IEEE (2011).
[5] "Sports Betting Information on Odds Shark." Sports Betting Odds. Web. 21 Jan. 2013.
[6] "ESPN NBA Scoreboard." NBA Basketball Scores. Web. 21 Jan. 2013.
[7] Roja, Raul. “AdaBoost and the Super Bowl of Classifiers: A Tutorial Introduction to Adaptive Boosting.” (2009).
[8] Shrestha, D.L. and Solomatine, D.P. “Experiments with AdaBoost.RT, an Improved Boosting Scheme for Regression.” Neural Computation (2006): 18:7, 1678-1710.
[9] "Reduced Error Pruning." Reduced Error Pruning. N.p., n.d. Web. 21 Jan. 2013.
[10] Webb, Geoffrey. Multiboosting: A Technique for Combining Boosting and Bagging. "Machine Learning" (2000)
[11] Zemel, R. S. and Pitassi, T. A gradient-based boosting algorithm for regression problems. Advances in neural information processing systems (2001), 696-702.
[12]
Gimpel. “Beating the NFL Football Point Spread”. University of Wisconsin
[13] Liu, Lai. “Beating the NCAA Football Point Spread”. Stanford Computer Science department (2010).