6. More of the above
Drawing
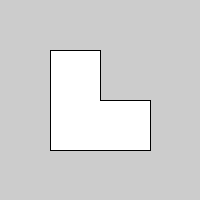
Rectangles and ellipses are great, but we often want fancier shapes. Processing provides a way to define a new shape by a set of vertices defining points on its boundary.
The vertices of a shape are specified via the vertex() function, which takes x and y coordinates. Before calling that function, we must tell Processing that we're starting a new shape, by calling the beginShape() function; when we've listed all the vertices, we must call the endShape() function. Parameters may be given to beginShape() to produce different forms -- individual points or lines, sets of individual triangles or quads, or tessellations. There is an optional parameter for endShape(); if it is given the value CLOSE, the last vertex is connected back to the first, while otherwise the shape is left open.
Colors are specified as usual by calling stroke() and fill() before beginShape().
function setup(){
    createCanvas(200,200);
    smooth();
}

function draw(){
    beginShape();
    vertex(50,50);
    vertex(50,150);
    vertex(150,150);
    vertex(150,100);
    vertex(100,100);
    vertex(100,50);
    endShape(CLOSE);
}
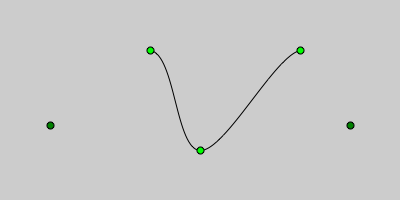
The segments of a shape can be curved rather than straight, by using curveVertex() instead of vertex(). Processing figures out how to draw good curves between vertices, using what are called Catmull-Rom splines. The first and last vertices aren't drawn as part of the curve, but are control points used to help set the curvature at the neighboring vertices. The overall amount of curvature can be set with the curveTightness() function, with increasing positive numbers bulging more and more, and increasing negative numbers bowing more and more.
function setup(){
      createCanvas(400,200);
      smooth();
      noFill();
}

function draw(){
      // draw curve
      beginShape();
      curveVertex(50,125);
      curveVertex(150,50);
      curveVertex(200,150);
      curveVertex(300,50);
      curveVertex(350,125);
      endShape();

      // show points
      fill(0,128,0);
      ellipse(50,125,7,7);
      fill(0,255,0);
      ellipse(150,50,7,7);
      ellipse(200,150,7,7);
      ellipse(300,50,7,7);
      fill(0,128,0);
      ellipse(350,125,7,7);
}
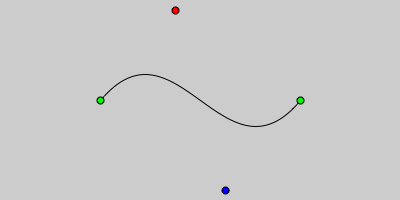
Bezier curves give more control over the curvature. These are the curve you probably used in drawing programs. In addition to the points on the curve (anchor points), Bezier curves also have associated control points that set the slope at the anchors. To specify a Bezier curve, we give the first vertex position with the regular vertex() function. Then we call the bezierVertex() function with the positions of two control points and an anchor point. The first control point (first two parameters) is for the preceding vertex and the second is for this one.
function setup(){
    createCanvas(400,200);
    smooth();
    noFill();
}

function draw(){
    // draw curve
    beginShape();
    vertex(100,100);
    bezierVertex(175,10,225,190,300,100);
    endShape();

    // show points
    fill(0,255,0);
    ellipse(100,100,7,7);
    fill(255,0,0);
    ellipse(175,10,7,7);
    fill(0,0,255);
    ellipse(225,190,7,7);
    fill(0,255,0);
    ellipse(300,100,7,7);
}
Interaction with state and conditionals
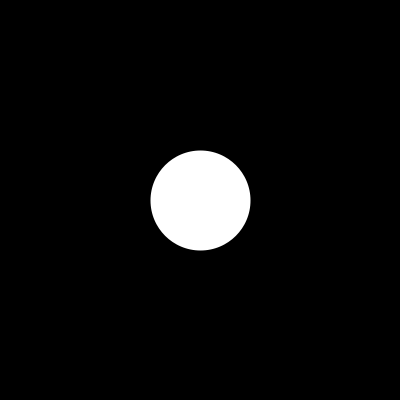
In the previous notes we discussed how to test whether the mouse is inside a rectangle. We can do something similar to see whether it is inside a circle by using the distance function, that computes the distance bwteen two points. To check if the mouse is inside a circle, we simply test if uts distance from the center is less or equal to the radius (note that the ellipse() takes the diameter).
function setup()
{
  createCanvas(400,400);
  smooth();
  noStroke();
}

function draw()
{
  background(0);
  // check if we are inside the ellipse
  if(dist(mouseX,mouseY,200,200) < 50) {
    fill(255,0,0);
  } else {
    fill(255,255,255);
  }
  ellipse(200,200,100,100);
}
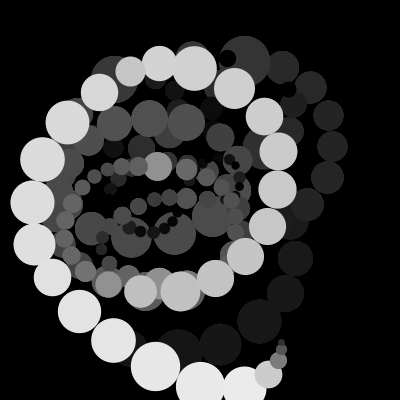
We can use the two mouse positions to control the drawing in a less direct fashion. The following sketch, inspired by the Processing example Topics | Drawing | Pattern sets the color and the size of the ellipse according to how far the mouse has moved. We first compute the distance between the old and the new mouse position using the dist() function. We stash this away in the variable distance (so we can reuse it in different places) and use it to determine the color and radius of the ellipse. Note that for the color we scale the value by 10, so we emply to function min() to ensure that we do not go above 255.
// Inspired by Processing demo "topics | drawing | pattern"

function setup()
{
  createCanvas(400,400);
  smooth();
  noStroke();
  frameRate(30);
  background(0);
}

function draw()
{
  // fade
  fill(0,2);
  rect(0,0,width,height);
  // compute the distance
  var distance = dist(pmouseX,pmouseY,mouseX,mouseY);
  // Set color from how far mouse has moved
  fill(min(255,8*distance));
  // Set size from how far mouse has moved
  ellipse(mouseX,mouseY,distance,distance);
}
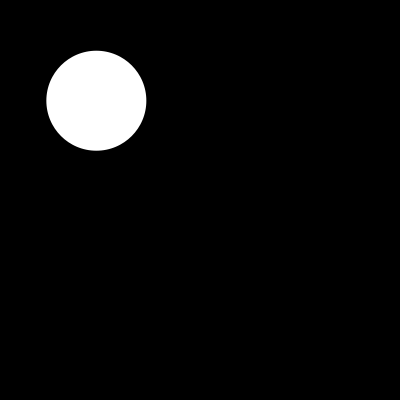
Let us make our circle a bit more alive in an example inspired by Topics | Interaction | Tickle.
By combining keys with state, we can let whoever is playing with our sketch control different aspects of it. Note the different types of the variables.
var x = 200; // current position
var y = 200; // current position
var r = 50; // current radius
var tickling = true; // tickling or poking
var strength = 10; // tickling strength

function setup()
{
  createCanvas(400,400);
  smooth();
  noStroke();
}

function draw()
{
  background(0);
  // check if we are inside the ellipse
  if(dist(mouseX,mouseY,x,y) < r) {
    // if tickling, move me
    if(tickling) {
      x = random(x-strength,x+strength);
      y = random(y-strength,y+strength);
    }
    else  // if pocking, change my size
      r = random(50-strength,50+strength);
  } else {
    r = 50;
  }
  // Set size from how far mouse has moved
  ellipse(x,y,r*2,r*2);
}

function keyPressed() {
  if(key == 't') tickling = !tickling;
  else if(key == 'm') strength = min(strength+5,20);
  else if(key == 'l') strength = max(strength-5,5);

  // print messages
  if(tickling) print("I am tickling"); else print("I am poking");
  println(" with "+strength+" strength");
}
This sketch produces some console output (at the bottom of the window in which you type your sketch) to describe the current state. This can be very useful in helping understand what's going on with a sketch when we're developing it. I also used it in the shape sketches above to print out instructions and the Processing commands. The print() and println() functions let us display something on the console; the latter forces a new line after printing. To print text, put it in double quotes. To print multiple things, combine them with a plus sign. Calling println() with no parameter simply forces the new line.
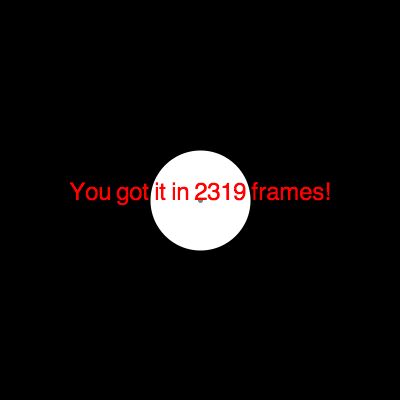
We can now make the previous sketch into a game. For example, let us see if you can make the ball touch the center by tickling it. You can restart the game in different positions by pressing 'a' to 'd'. The variable frameCount holds how many frames where drawn here (used here to show you how much time it took to get the ball in the center).
var x = 300; // current position
var y = 300; // current position
var r = 50; // current radius
var strength = 5; // tickling strength
var won = false; // whether or not we won

function setup()
{
  createCanvas(400,400);
  smooth();
  noStroke();
  textFont(loadFont("Helvetica-24.vlw"));
  textAlign(CENTER);
 }

function draw()
{
  // only continue if we did not win
  if(!won) {
    background(0);
    // check if we are inside the ellipse
    if(dist(mouseX,mouseY,x,y) <= r) {
      // tickle
      x = random(x-strength,x+strength);
      y = random(y-strength,y+strength);
    }
    // Set size from how far mouse has moved
    fill(255);
    ellipse(x,y,r*2,r*2);
    // draw the center
    fill(128);
    ellipse(width/2,height/2,5,5);

    // check if I won
    won = dist(x,y,width/2,height/2) <= r;
    // print a message if I won
    if(won) {
      fill(255,0,0);
      text("You got it in "+frameCount+" frames!",width/2,height/2);
    }
  }
}

function keyPressed() {
  // restart in different positions
  if(key == 'a') { x= 300; y = 300; won = false; frameCount = 0; }
  else if(key == 'b') { x= 100; y = 300; won = false; frameCount = 0; }
  else if(key == 'c') { x= 300; y = 100; won = false;frameCount = 0; }
  else if(key == 'd') { x= 100; y = 100; won = false; frameCount = 0; }
  else if(key == 'w') { x = width/2; y = height/2; } // if you cannot make it
}