22. Recursion
Recursion is basically when something is defined in terms of itself. To afunction an infinite regression, however, we have to make sure that there is some difference between the original and its self-referential definition, and that we know when to stop self-referencing. An example is a tournament. To find the best two players (or teams, depending on the type of tournament), we find the best from one half of the league and have them compete against the best from the other half. To find the best from one half, we pit the best from half of that against the best from the other half of that (the quarterfinals). And so forth, down to the initial set of players or teams. "The best" of a group is defined in terms of "the best" of a sub-group, and eventually the sub-sub-...-sub-groups are small enough (here, just one member) that we can stop.
Recursive Drawing
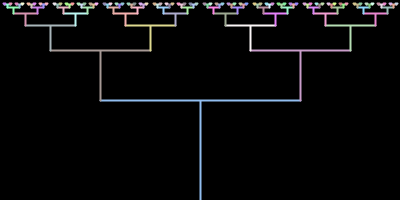
Reas & Fry 22-09 shows how to draw something that looks kind of like a tournament chart (upside down). Here is simplified version. We start with the ability to draw a single "T":
line(x, y, x, y-r);  // vertical

line(x-r, y-r, x+r, y-r);  // horizontal
Then we stack two smaller "T"s, of size r/2, on top of that "T" — one starting at (x-r,y-r) and the other starting at (x+r,y-r). To draw each of those "T"s, we do exactly the same thing, although the values used in the function are now different — the new x is the old x, plus or minus r, the new y is the old y minus r, and the new r is the old r divided by two. Then each of those "T"s stacks a pair of "T"s on top of it, and so on. To keep from getting microscopically small "T"s, we only continue stacking if r is at least 1.
We can express this in code by having a function calling itself. The idea here is that we call the function to draw a "T". That function will then call itself again to draw the "T" with other parameters. Within the function, we can check whether we should continue calling ourselves too and stop when done. Here is an implementation of this. Note that I randomly choose the color each time we we call drawT.
// Simplified from Reas & Fry 22-09

function setup() {
  createCanvas(400,200);
  smooth(); strokeWeight(2);
}

function draw() {
  if(frameCount > 1) return; // do in once only
  background(0);
  drawT(width/2, height, width/4);
}

function drawT(x, y, r)
{
  // a new color each time
  stroke(random(128,255),random(128,255),random(128,255));

  line(x, y, x, y-r);  // vertical
  line(x-r, y-r, x+r, y-r);  // horizontal

  if (r>1) {  // only continue stacking if half size will be non-zero
    drawT(x-r, y-r, r/2);  // stack on left side
    drawT(x+r, y-r, r/2);  // stack on right side
  }
}
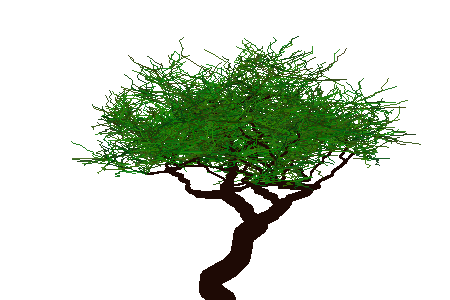
Greenberg (2-01) gives an even cooler looking tree. I've simplified the code here to bring out the analogous recursive structure. This sketch doesn't use the translate/rotate approach, but instead explicitly keeps track of the (x,y) coordinates of where a branch starts. Then each branch is a "twisted" line rather than a straight one — put several random segments together going the same vertical distance, but with random offsets for the horizontal positions along the way. Furthermore, the branches are thicker at the bottom than at the top, and their lengths are random (with the possible length being varied as we go up the tree). The variable depth refers to how far away we are from the trunk (0 for the closest ones), so "deeper" branches are towards the top of the tree. Near the top of the tree, the branches are drawn greenish, to give an appearance of leaves. There are some magical choices made to control the branch lengths (e.g., in the difference in the length adjustment for deeper branches); I've left the basic structure intact, but they don't give quite the same effect as in Greenberg's sketch.
// Simplified from Greenberg 2-01

// how many recursions drawing branches, and overall (rest drawing "leaves")
var branchDepth=4, leafDepth=6;

function setup()
{
  createCanvas(450,300);
}

function draw() {
  if(frameCount % 60 != 0) return;

  background(255);
  strokeWeight(20);
  stroke(30,10,5);
  var trunkLength = random(65,90);
  var numTrunkSegments = floor(random(7,12));
  var x = orgLine(width/2,height, width/2,height-trunkLength, numTrunkSegments, 22);
  branch(x, height-trunkLength, 0, 12, 25, 15);
}

// x and y are start of branch
// depth is how many recursive calls
// thickness is weight of stroke for branch
// xo and yo are initial offsets for incrementing x and y (plus an additional random amount)
function branch(x, y, depth, thickness, xo, yo)
{
  if (depth <= leafDepth) {
    var numBranches=2; // more numerous branches higher up
    if (depth>branchDepth) numBranches = floor(random(2,17));
    var dir=1; // alternate left/right
    for (var i=0; i<numBranches; i++) {
      // end of branch
      var x2 = x+dir*(xo+random(-15,15));
      var y2 = y-yo+random(-20,20);
      dir = -dir;

      // draw branch
      strokeWeight(thickness);
      // branch or "leaf" color
      if (depth <= branchDepth) stroke(30,10,5);
      else stroke(random(60),random(50,140),random(20),230);
      // line(x,y, x2,y2);
      x2 = orgLine(x,y, x2,y2, 8, 5);

      // branches shorten and thin out
      var thick2 = thickness*pow(0.75,numBranches);
      var xo2, yo2;
      if (depth<branchDepth) {
        xo2 = xo-numBranches*random(.5);
        yo2 = yo-numBranches*random(.25);
      }
      else {
        xo2 = xo-numBranches*random(1.5);
        yo2 = yo-numBranches*random(.75);
      }

      // recursive call
      branch(x2,y2,depth+1,thick2,xo2,yo2);
    }
  }
}

// generates oragnic looking branches
// y will end up at y1, but x may be off some, so it's returned
function orgLine(x1, y1, x2, y2, numSections, maxTwist)
{
  var dx=(x2-x1)/numSections, dy=(y2-y1)/numSections;

  var x=x1, y=y1;
  // each section increments y by dy, and x by dx plus a random "twist" amount
  for (var i=0; i<numSections; i++) {
    var twist = random(-maxTwist,maxTwist);
    var xn=x+dx+twist, yn=y+dy;
    line(x,y, xn,yn);
    x = xn; y = yn;
  }

  return x;
}
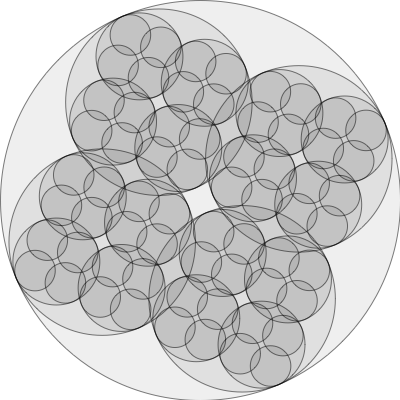
The idea of splitting something in half (or thirds, or whatever) and doing something for each half (or other fraction) is a very common one, both in solving problems (think of trying to find a word in the dictionary) and in generating complex visualizations. A couple of Processing examples render a "binary tree" structure with discs instead of as a tree. Basics | Structure | Recursion draws a big circle, and within that circle draws two smaller circles, each of which draws two still smaller circles, etc. Basics | Structure | Recursion2 then injects some randomness, giving from 2 to 6 sub-circles positioned around inside the circle, at random angular spacing. The following sketch demonstrates something similar.
function setup()
{
  createCanvas(400,400);
  smooth();
}

function draw() {
  background(255);
  drawCircle(width/2,height/2,width/2,3);
}

function drawCircle(x, y,  r,  d) {
  fill(0,16); stroke(0,128);
  ellipse(x,y,2*r,2*r);

  if(d > 0) {
    var rr = r / map(mouseX,0,width,2,4);
    var a = map(mouseY,0,height,0,PI);
    drawCircle(x+(r-rr)*cos(a),y+(r-rr)*sin(a),rr,d-1);
    drawCircle(x+(r-rr)*cos(a+PI/2),y+(r-rr)*sin(a+PI/2),rr,d-1);
    drawCircle(x+(r-rr)*cos(a+PI),y+(r-rr)*sin(a+PI),rr,d-1);
    drawCircle(x+(r-rr)*cos(a+3*PI/2),y+(r-rr)*sin(a+3*PI/2),rr,d-1);
  }
}
Recursive Objects
While so far we have seen how to recursively specify drawing commands via functions, we can also resursively specify objects. The next sketch we will cover is inspired by the DrunKandinsky sketch of Sean McCullough.
The fundamental idea here is to specify objects that are defined with respect to other objects. In our example, a 'root' disk is stored in the sketch. This object will in turn contain other disks, that contain other disks, etc. To draw the whole structure, we call the 'root' draw method that in turns call its disks draw methods. Since we have objects, we can now change their behavior, in our case by changing the angle of rotation. Again, the change is made at the root, and is propagated from parent to children. The size and position of each child is calculated relative to the current values for the parent. Also, note the use of transformations to draw, that makes all our arithmetic much easier.
let root;

let showTree = false; // whether to show the tree

function setup()
{
  createCanvas(400,400);

  root = new Disk(width/2,height/2,width/2,3);
}

function draw() {
  background(255);

  root.draw();
  root.update();
}

function keyPressed() {
  if(key == 't') showTree = !showTree;
}
Fractals
Fractals are a class of recursively defined geometric shapes, where the structure at a finer resolution is similar to that at a coarser resolution. Our trees are fractals; for some amazing examples of natural-looking fractals (and recursively constructed things more generally), see the book Algorithmic Beauty of Plants, available electronically (but worth seeking out as a book). Other fractals aren't so natural-looking, but have a different type of beauty, e.g., the famous Mandelbrot set. (Images below from Wikimedia Commons.)


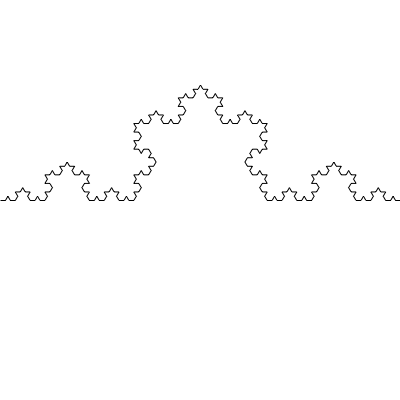
Here is a very simple example of these recursive structures, called a "Koch snowflake". The basic idea is to take a segment and recursively divide it into four segments. The first segment is the first third of the original segment, and the last segment is the last third. The middle two segments then jut out triangularly from the original segment. (It's an equilateral triangle, so a little trig lets us calculate the coordinates of the jutted-out point. The following sketch proceeds one level deeper into the recursion each time the mouse is pressed. It keeps a list of the vertices of the segments, and for each recursion inserts three interior points (1/3, 1/2-jutted, and 2/3) between each pair.
let x, y;  // Coordinates of the points on the curve
let depth;     // How deeply we've recurse

function setup()
{
  createCanvas(400,400);
  background(255);
  initKoch();
  drawCurve(x,y);
}

function draw()
{}

// Each time the mouse is pressed, recurse one more level
function mousePressed()
{
  background(255);
  depth++;
  if (depth==6) initKoch(); // wrap around
  else expandKoch();
  print(depth);
  drawCurve(x,y);
}

// Set up the initial curve -- a horizontal line
function initKoch()
{
  depth = 0;
  x = new Array(2);
  y = new Array(2);
  x[0] = 0; y[0] = height/2;
  x[1] = width; y[1] = height/2;
}

// Update the points by putting a triangular part jutting out
// between each pair of points in the current set
function expandKoch()
{
  // new points
  let l2 = 1 + 4*(x.length-1);
  let x2 = new Array(l2), y2 = new Array(l2);
  // index into new points
  var i2=0;

  for (var i=0; i<x.length-1; i++) {
    // consider each adjacent pair of points
    var dx = x[i+1]-x[i], dy = y[i+1]-y[i];
    // first point is the same
    x2[i2] = x[i]; y2[i2] = y[i];
    // second point is 1/3-way between
    x2[i2+1] = x[i]+dx/3; y2[i2+1] = y[i]+dy/3;
    // third point is 1/2-way between, sticking out
    x2[i2+2] = x[i]+dx/2 + sin(radians(60))*dy/3;
    y2[i2+2] = y[i]+dy/2 - sin(radians(60))*dx/3;
    // fourth point is 2/3-way between
    x2[i2+3] = x[i]+dx*2/3; y2[i2+3] = y[i]+dy*2/3;
    i2 += 4;
  }
  // last point is the same
  x2[l2-1] = x[x.length-1]; y2[l2-1] = y[y.length-1];
  x = x2; y = y2;
}

// draw a shape with vertices for the points
function drawCurve(x, y)
{
  beginShape();
  for (var i=0; i<x.length; i++)
    vertex(x[i],y[i]);
  endShape();
}
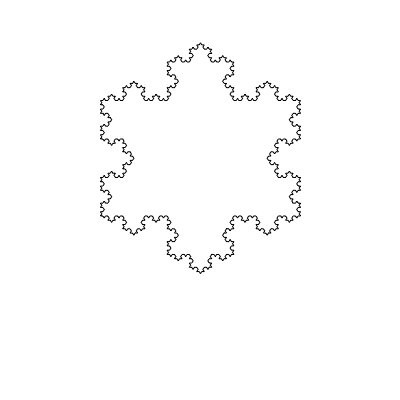
Now to generate a snowflake, we do this for each side of a triangle. That just requires appropriately rotating and translating the computed curve. (The curve is put at the origin, to allow the rotation and translation, and is a bit smaller, so the snowflake will fit.
var[] x, y;  // Coordinates of the points on the curve
var depth;     // How deeply we've recurse

function setup()
{
  createCanvas(400,400);
  smooth();
  background(255);
  initKoch();
  drawSnowFlake();
}

function drawSnowFlake()
{
  pushMatrix();
  translate(width/4,height/4);
  drawCurve(x,y);
  popMatrix();

  pushMatrix();
  translate(width*3/4,height/4);
  rotate(radians(120));
  drawCurve(x,y);
  popMatrix();

  pushMatrix();
  translate(width/2, height/4+width/2*sin(radians(60)));
  rotate(radians(240));
  drawCurve(x,y);
  popMatrix();
}

function draw()
{}

// Each time the mouse is pressed, recurse one more level
function mousePressed()
{
  background(255);
  depth++;
  if (depth==6) initKoch(); // wrap around
  else expandKoch();
  console.log(depth);
  drawSnowFlake();
}

// Set up the initial curve -- a horizontal line
function initKoch()
{
  depth = 0;
  x = new var[2];
  y = new var[2];
  x[0] = 0; y[0] = 0;
  x[1] = width/2; y[1] = 0;
}

// Update the points by putting a triangular part jutting out
// between each pair of points in the current set
function expandKoch()
{
  // new points
  var l2 = 1 + 4*(x.length-1);
  var[] x2 = new var[l2], y2 = new var[l2];
  // index into new points
  var i2=0;

  for (var i=0; i<x.length-1; i++) {
    // consider each adjacent pair of points
    var dx = x[i+1]-x[i], dy = y[i+1]-y[i];
    // first point is the same
    x2[i2] = x[i]; y2[i2] = y[i];
    // second point is 1/3-way between
    x2[i2+1] = x[i]+dx/3; y2[i2+1] = y[i]+dy/3;
    // third point is 1/2-way between, sticking out
    x2[i2+2] = x[i]+dx/2 + sin(radians(60))*dy/3;
    y2[i2+2] = y[i]+dy/2 - sin(radians(60))*dx/3;
    // fourth point is 2/3-way between
    x2[i2+3] = x[i]+dx*2/3; y2[i2+3] = y[i]+dy*2/3;
    i2 += 4;
  }
  // last point is the same
  x2[l2-1] = x[x.length-1]; y2[l2-1] = y[y.length-1];
  x = x2; y = y2;
}

// draw a shape with vertices for the points
function drawCurve(var[] x, var[] y)
{
  beginShape();
  for (var i=0; i<x.length; i++)
    vertex(x[i],y[i]);
  endShape();
}